LDA Training Course
Last updated: October 1, 2018
Chapter 1: Intro
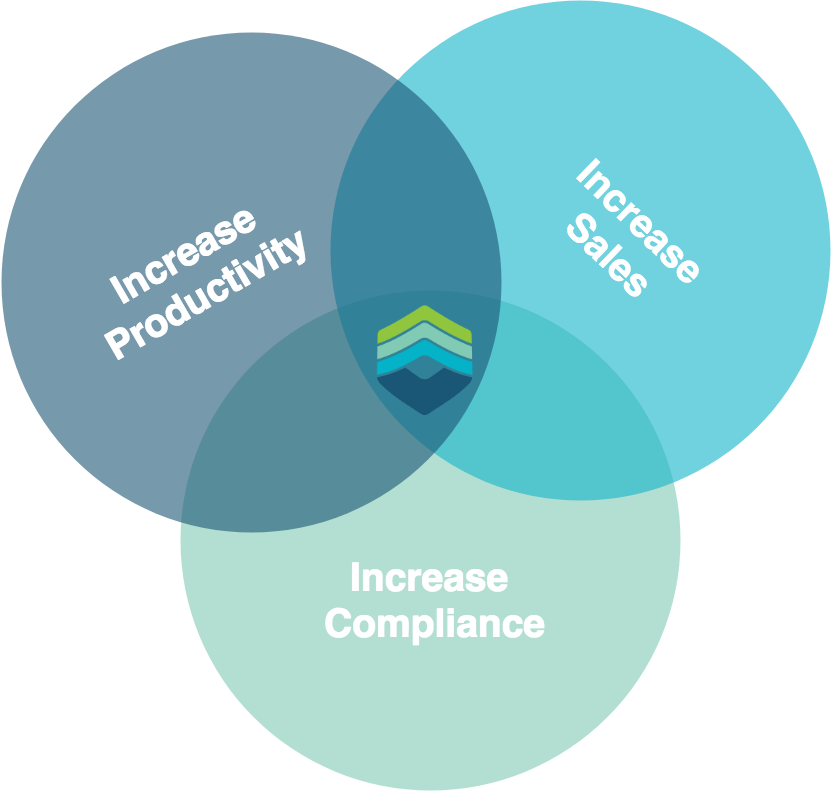
Welcome to Life Design Analysis, or LDA as we might refer to it from time to time. Life Design Analysis is a web-based service and is accessible by any connected device (meaning smartphone, tablet or computer regardless of operating system). LDA has many functions designed to help you in 3 key areas:
- Creating Efficiencies - We want to create value by making your time planning for a case the most efficient experience we can. At Life Design Analysis we know saving time is making money.
- Increasing Sales - Not only do we want to save you time, but we want to help you increase your sales. We do this with stunning presentations that give clients options and sell them by increasing client advisor communication and engagement.
- Compliance - We want to help you keep your practice defensible not only to the current compliance requirement, but also to the evolving landscape. We do this with notifications on critical policy sales and service opportunities, needs analysis tools, forms library and backup of all cases so you automatically document how you reached your recommendation.
In this guide, we’re going to show you how to use Life Design Analysis software to enhance your practice. If you need help or clarification on any concept you see in the guide of video, please feel free to contact us.
Accompanied by this welcome video: https://youtu.be/8Ks0Cz9VbgY
Chapter 2: Login
- To login visit https://lifedesignanalysis.com. In the upper right corner, you will see a login button. Feel free to add a bookmark or save as a favourite and use for every case!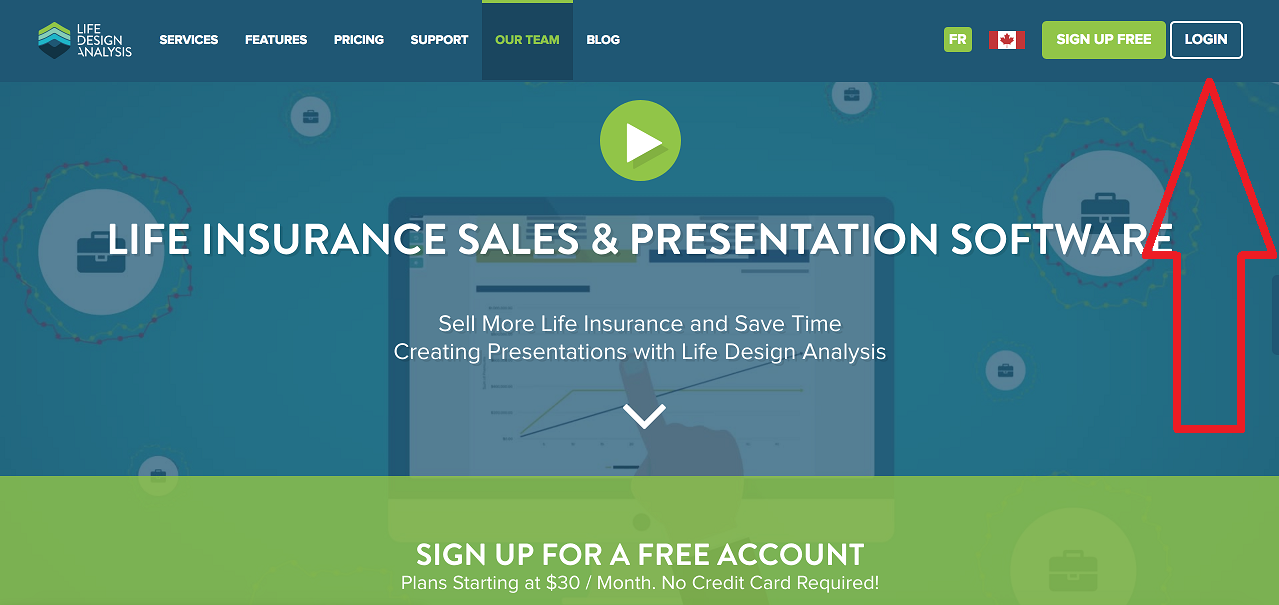
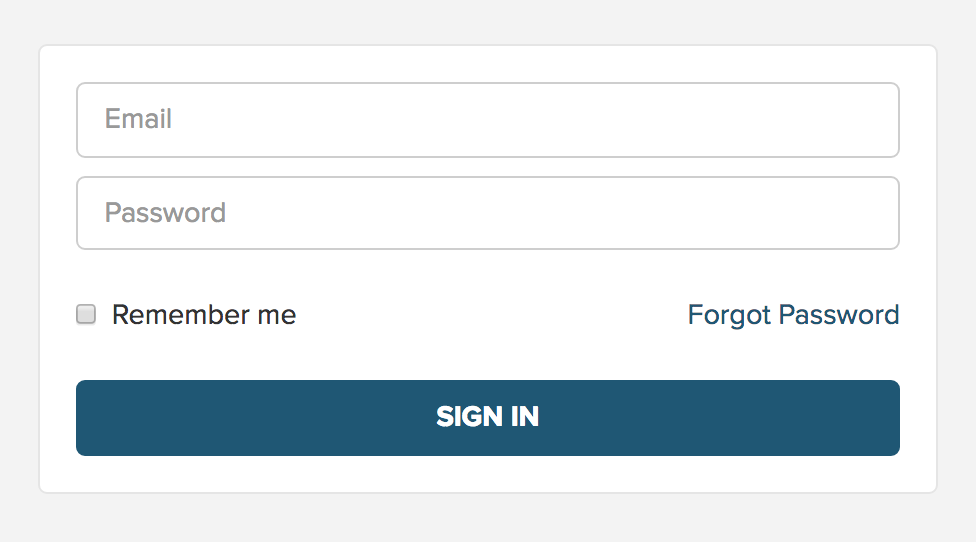
Enter your email that was used for signup and your password.
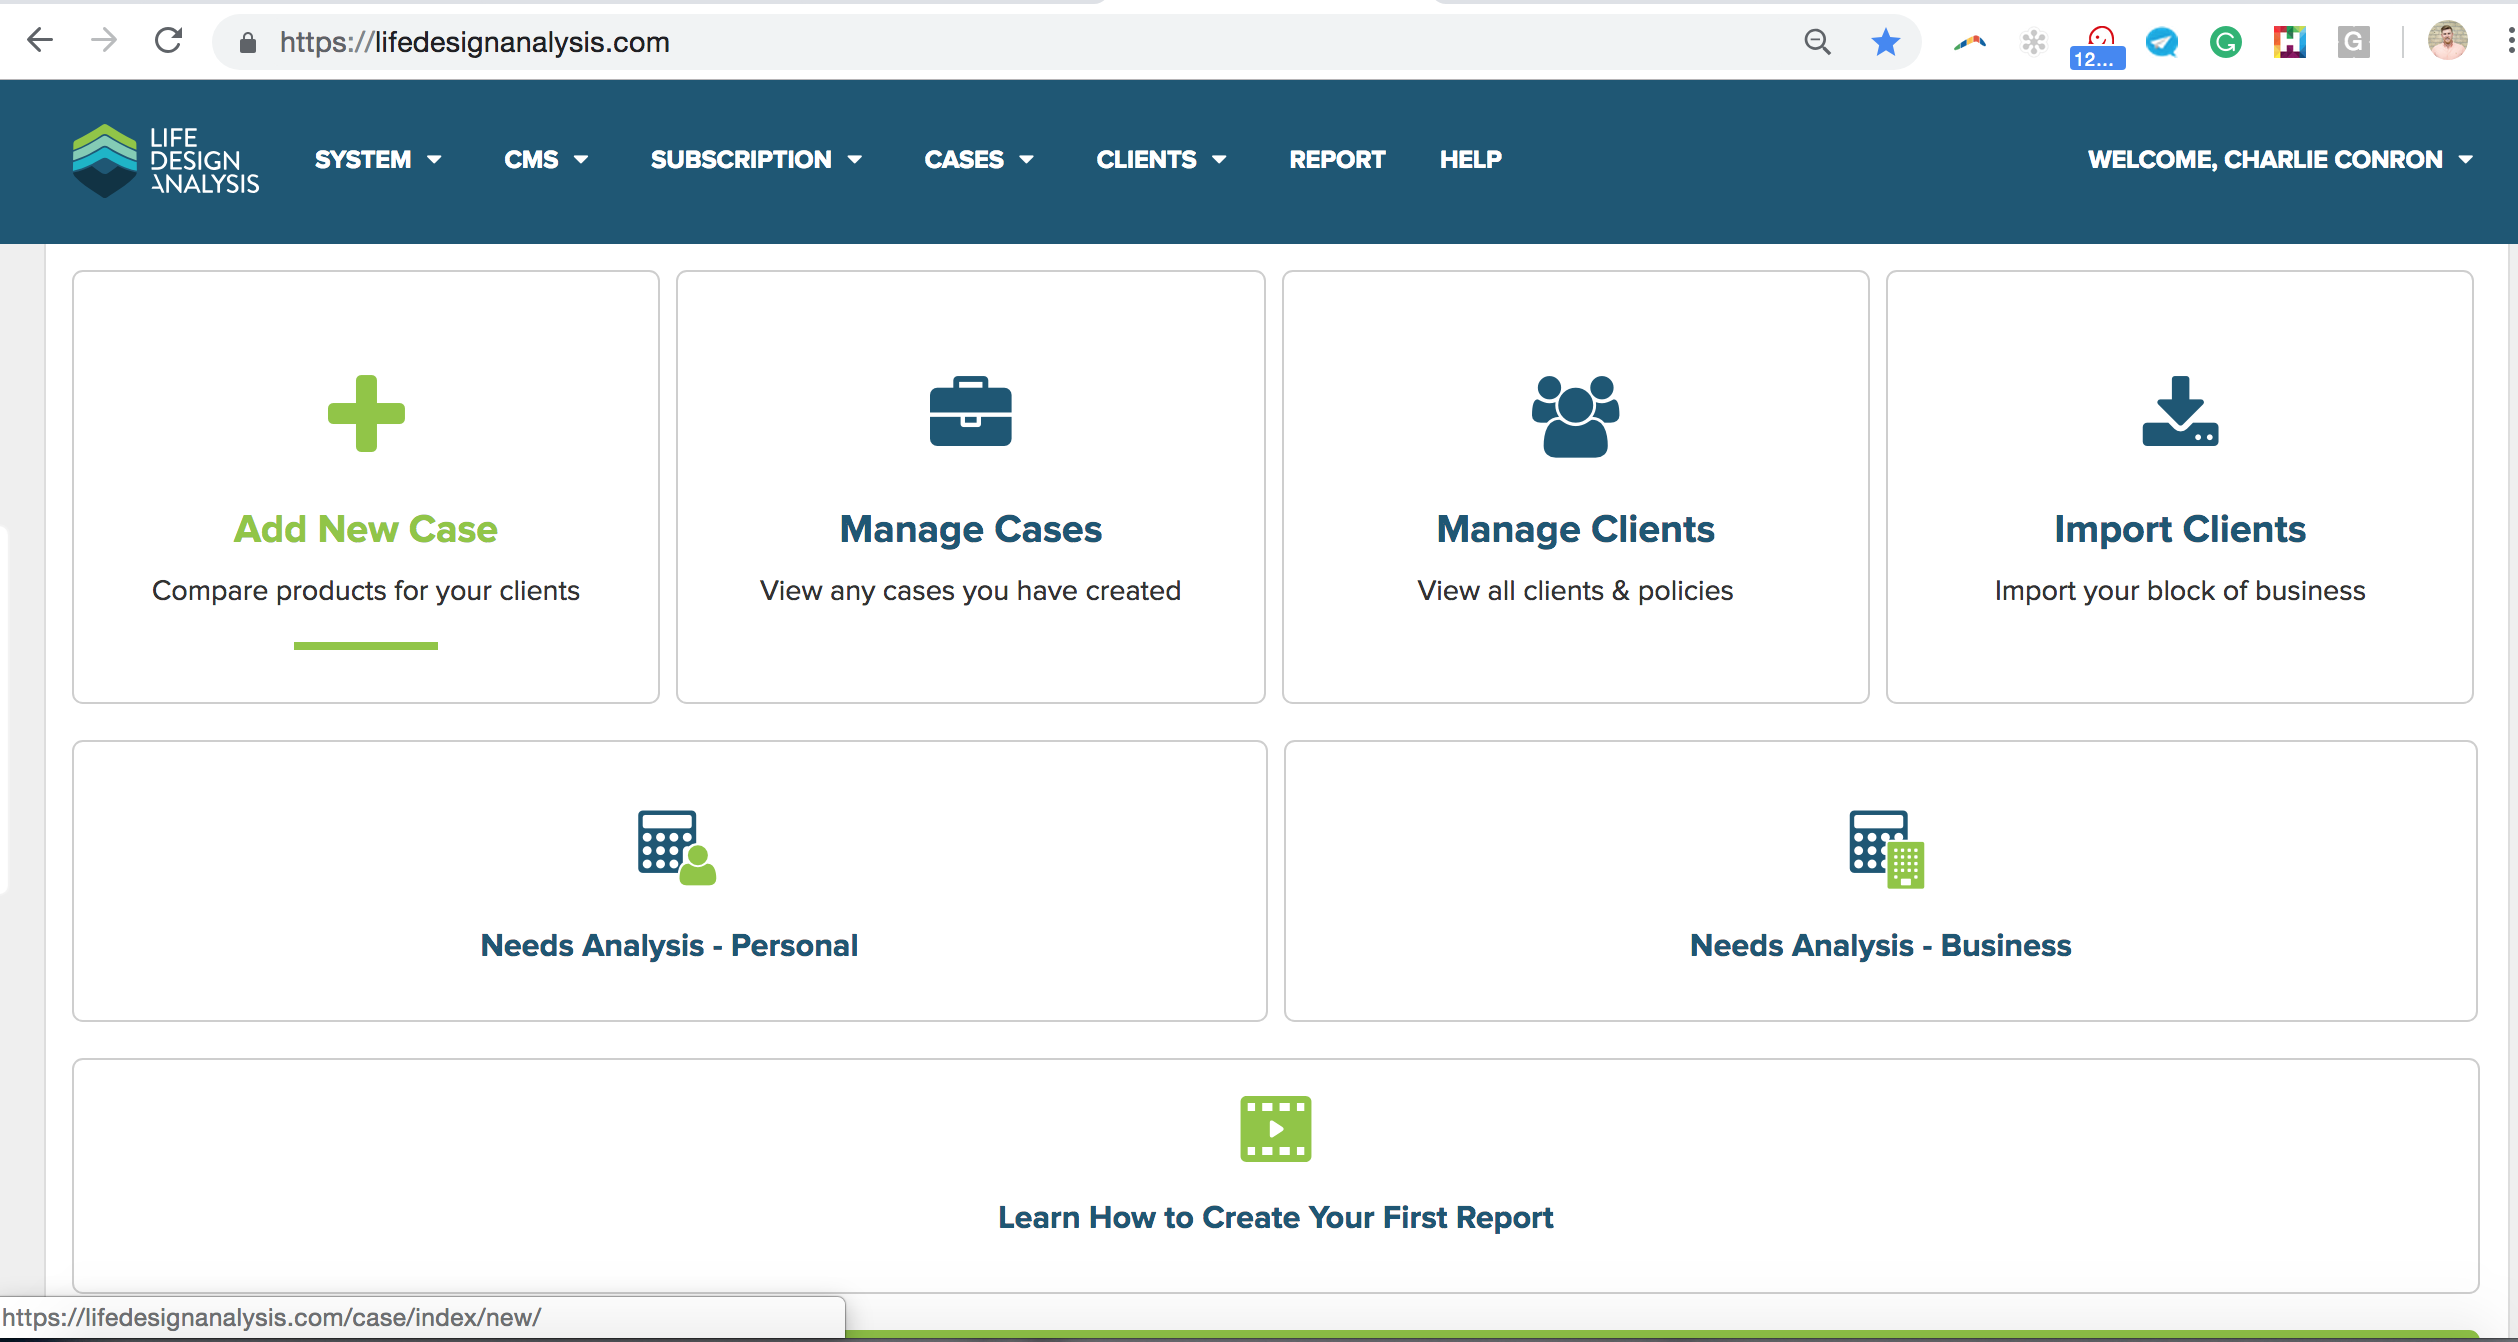
You will be taken to the main dashboard (if you ever want to get back here from another page, click our logo in the upper left).
Chapter 3: Customize Account
- When you first log into LDA, I recommend taking a few minutes to customize your account settings, that way all future reports will have your contact details.
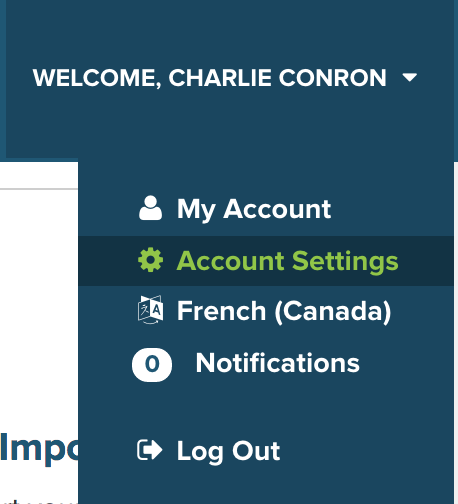
Step 1 - Brand your report with your logo or add additional detail to your reports such as your designations beside your presented by name. Change templates or colour options and customize disclaimer pages that can be used to communicate licenced carrier contracts and ensure certain compliance requirements are included in every report you create and present.
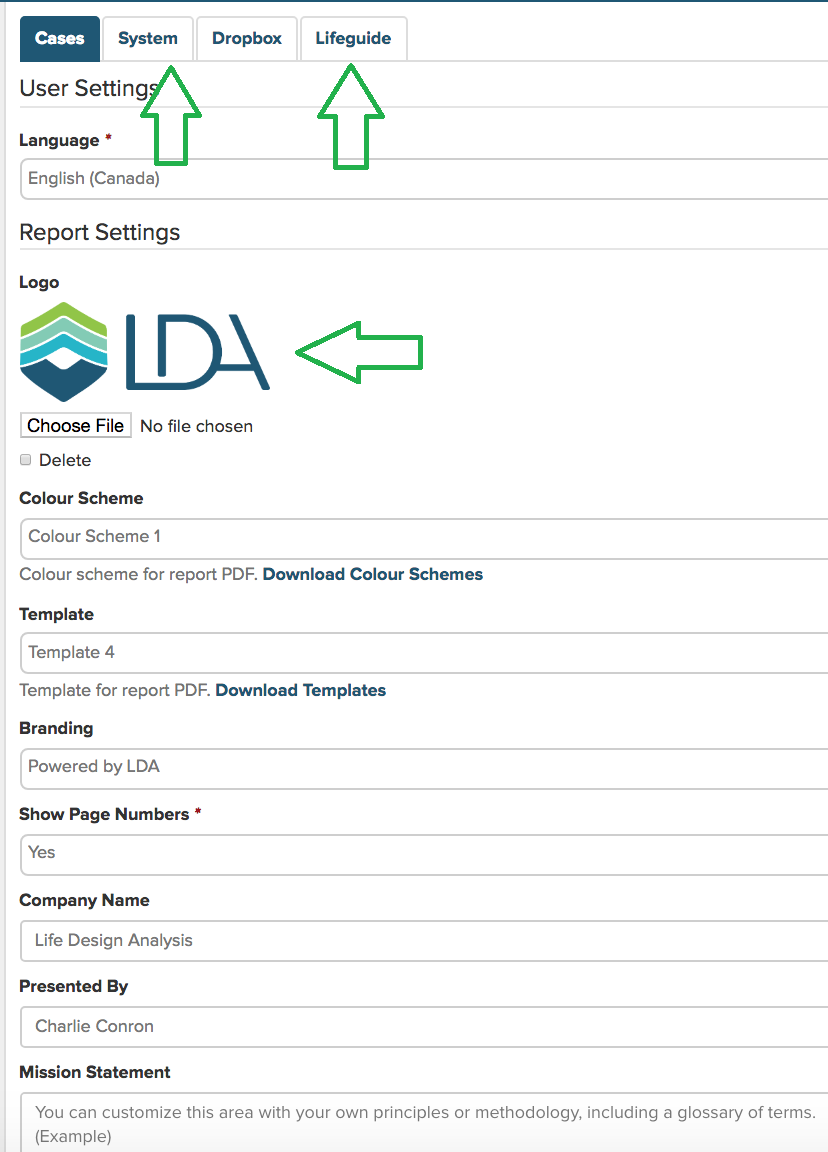
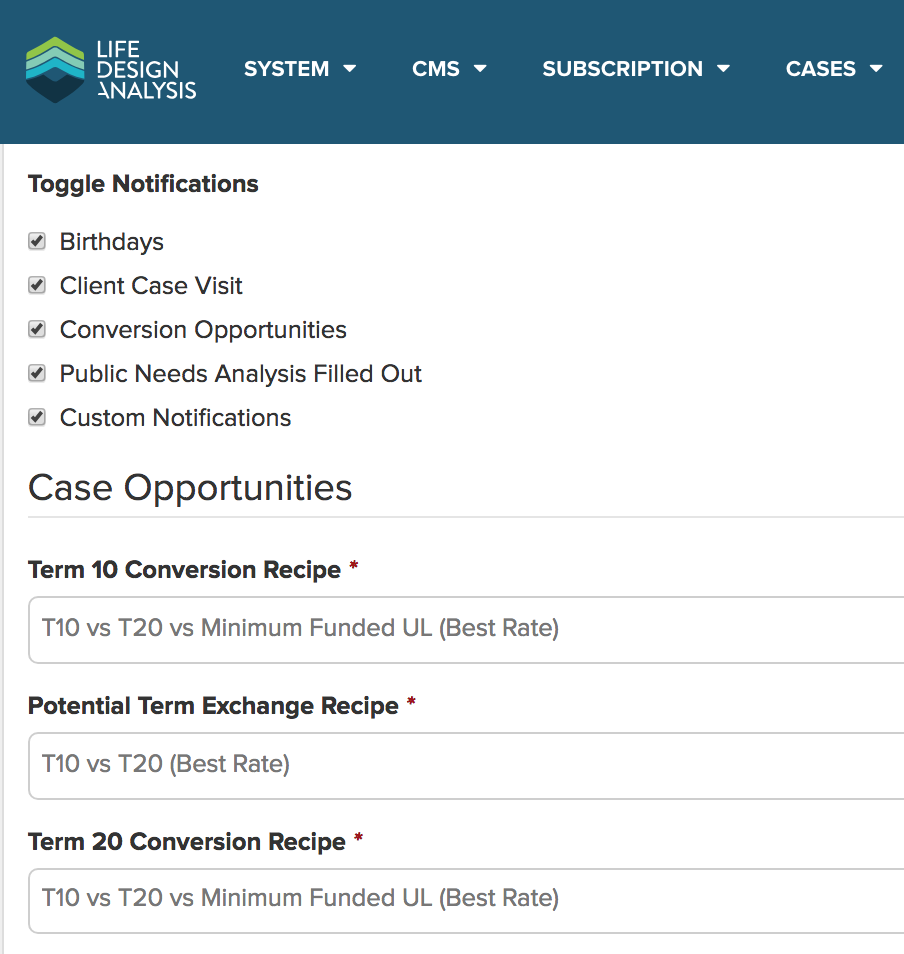
Step 2 - You can also customize system preferences like the notifications and frequencey of those notifications as well as inforce policy automation preferences.
Step 3 - You can customize your search preferences and prefered companies in the LifeGuide tab.

Step 4 - Save the changes you made. That way every new report will reflect those changes. 
Chapter 4: Creating Your First Report
To create your first report, navigate back to the main dashboard and select +Add New Case
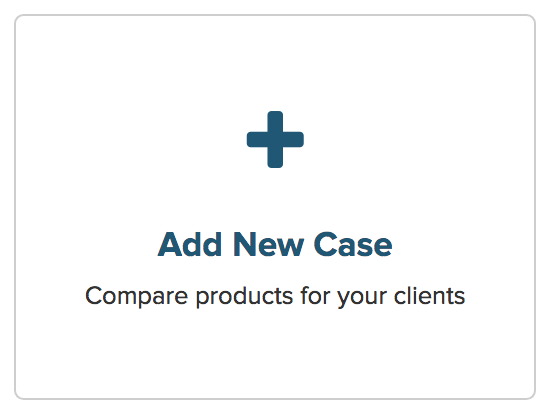
If this is your first case, you will have to create a new client. (You can import your block of business to bring in all clients. We cover this in Chapter 9.)
Step 1
Creating your first client is easy. Click the

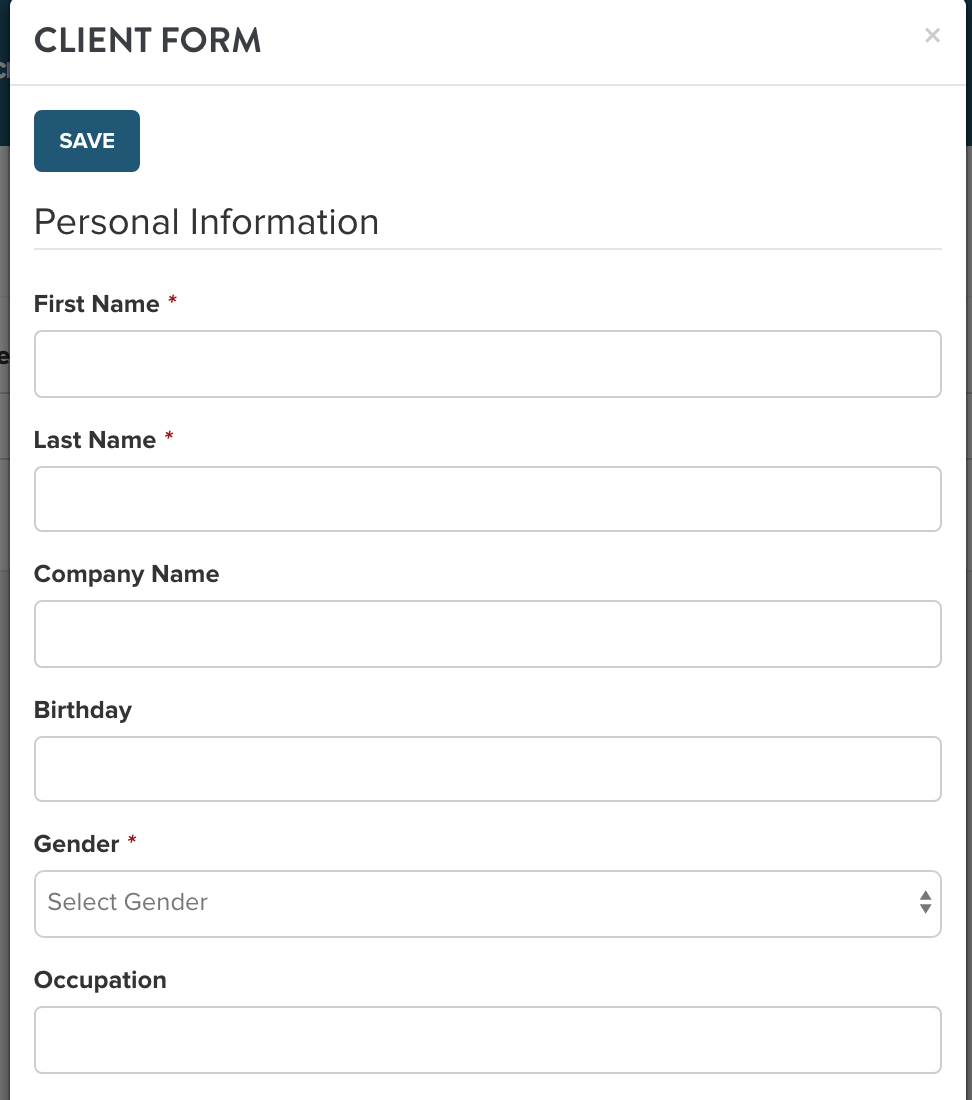
Click save. Then click continue. Now the client is created and you don’t ever have to enter their details again.
Once you hit continue, you will be taken to the Design Case page. This is where we will add all the products we want to compare.
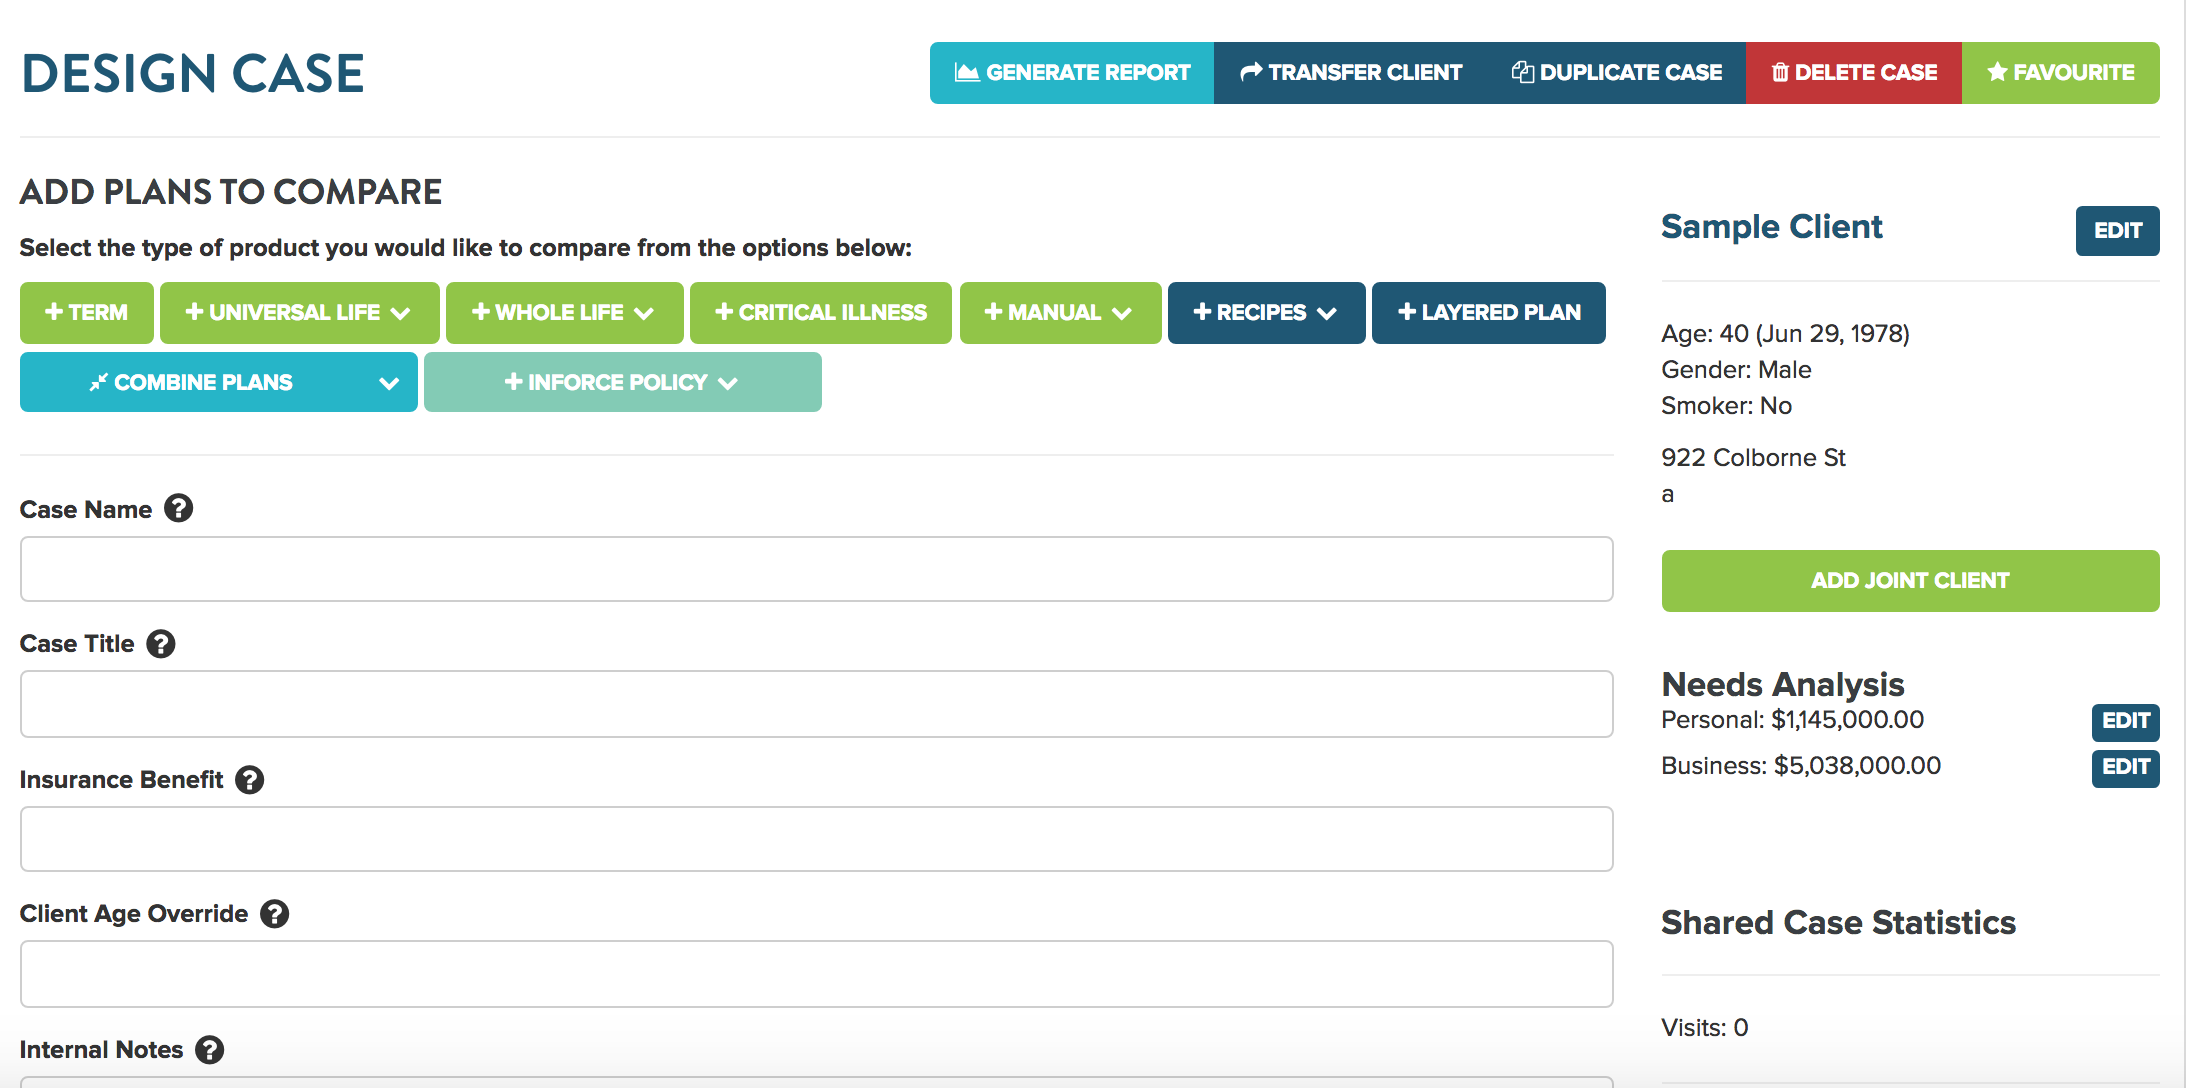
Use the green +Product buttons to add products the “case” you are working on.

Simply select the product type that you would like to add, change any search parameters and hit search.
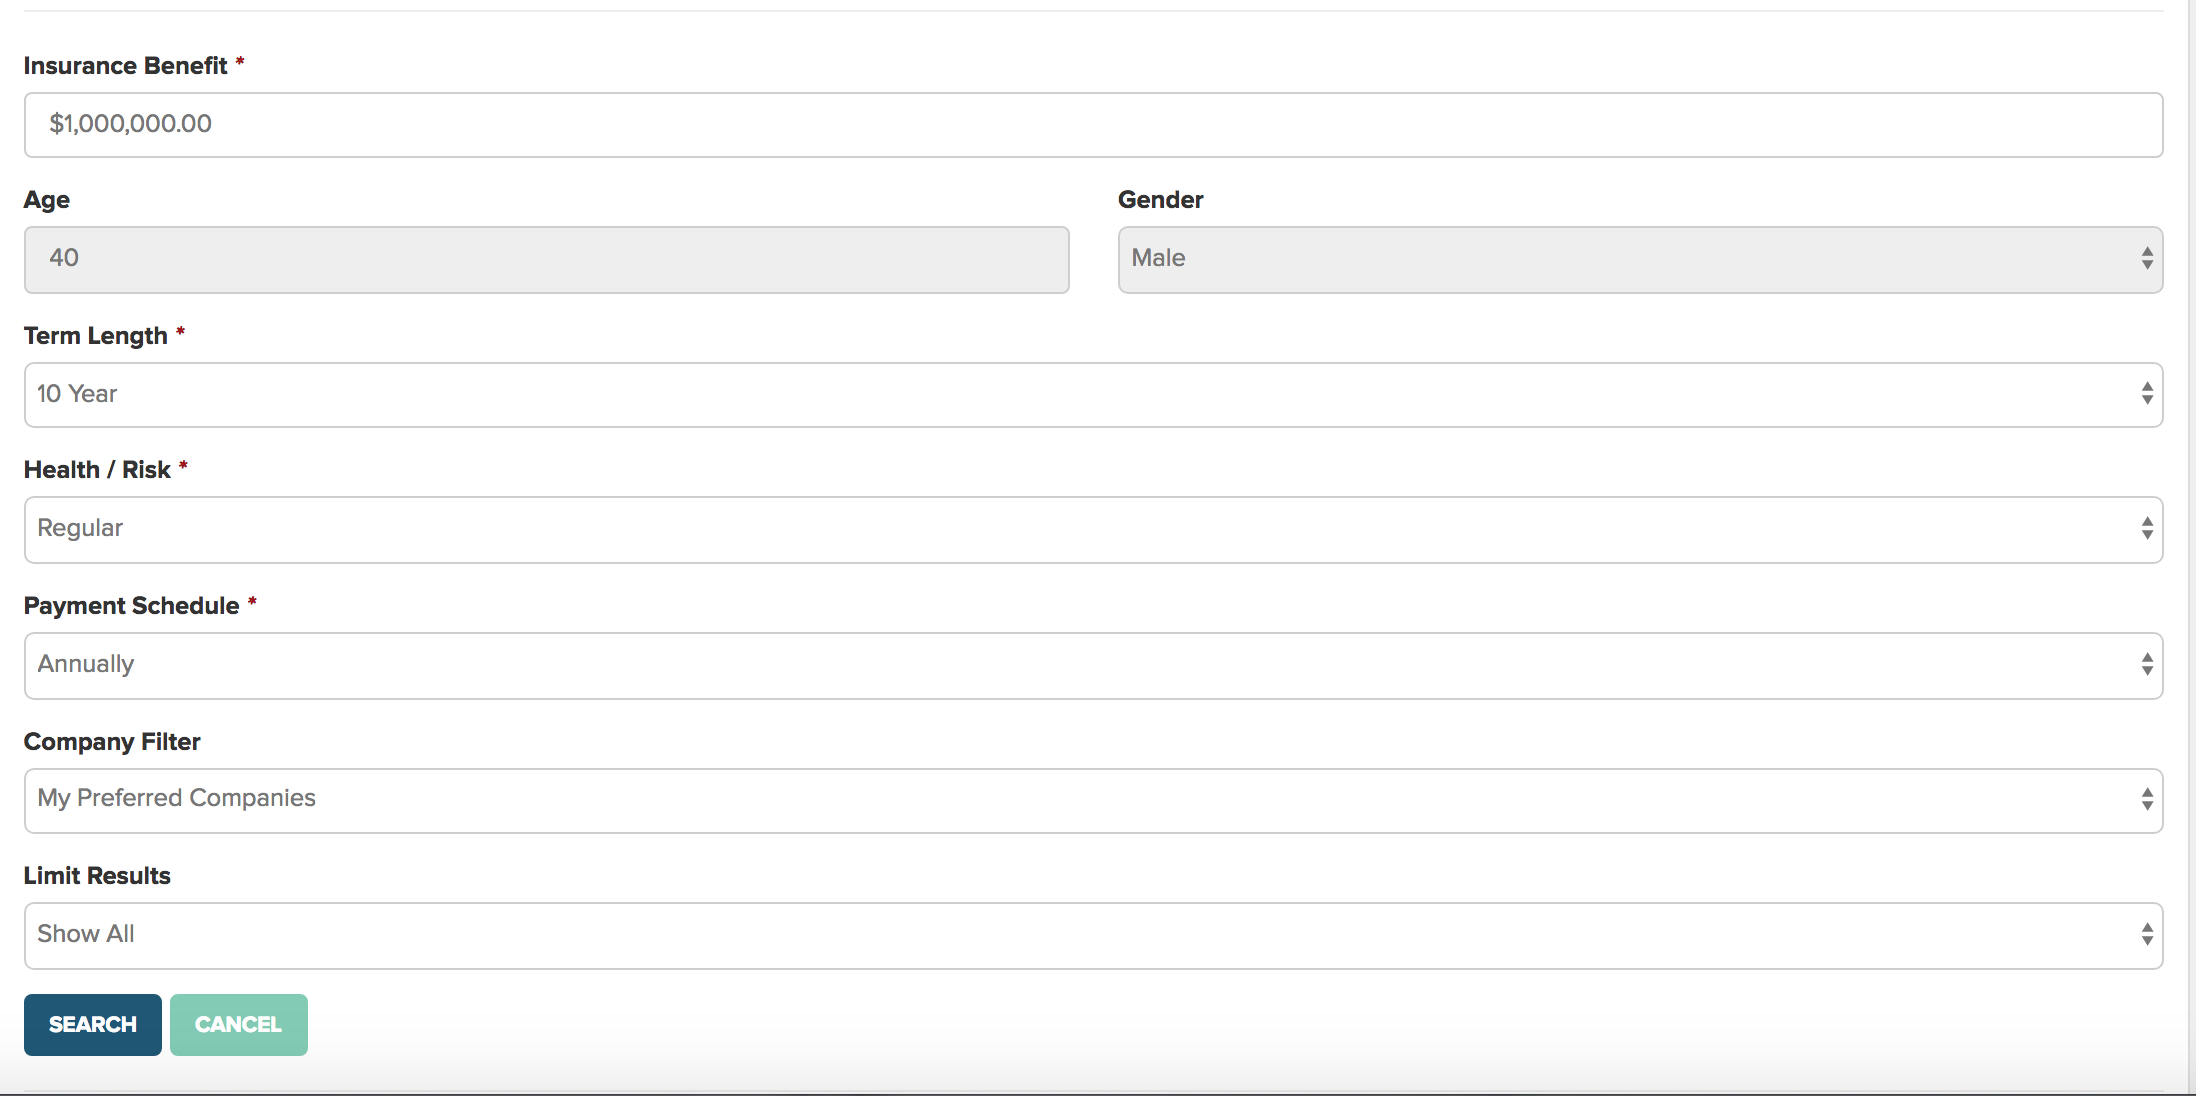
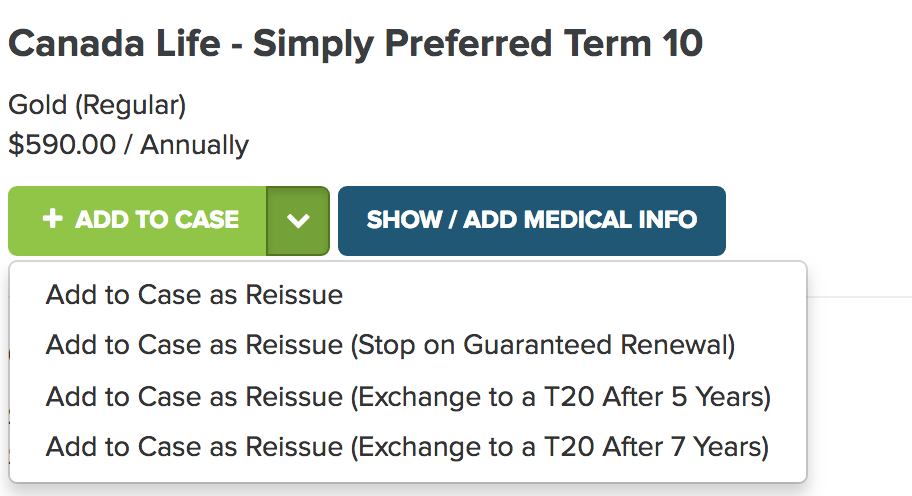
Select the product you wish to incldue by selecting + add to case
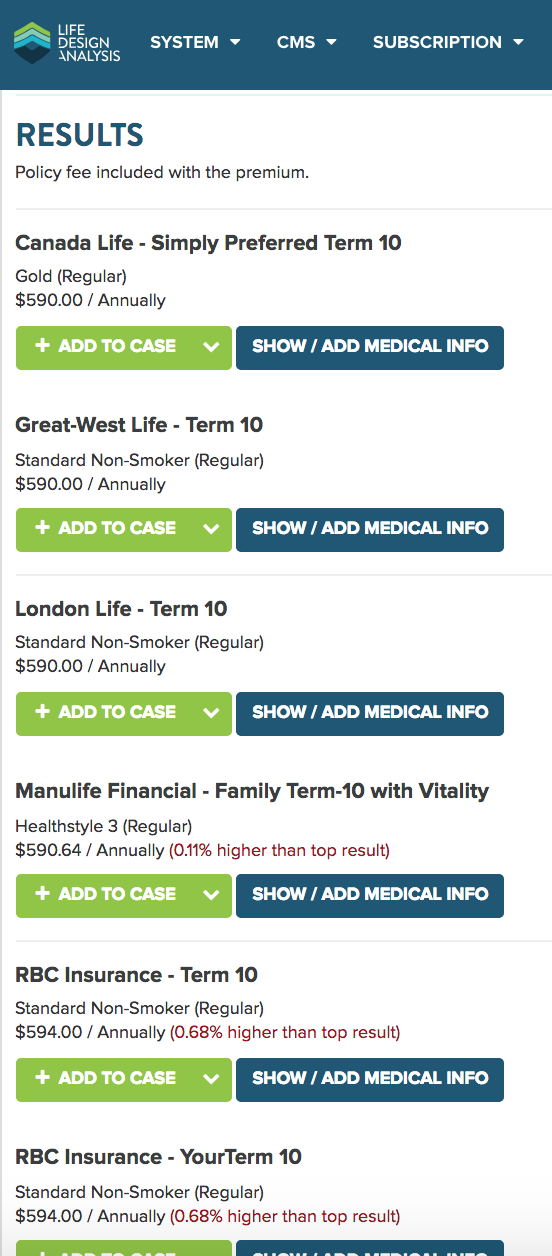
Term products can be selected as a rewrite (Video Link) or exchange as well!
Some Product types allow you to upload via a
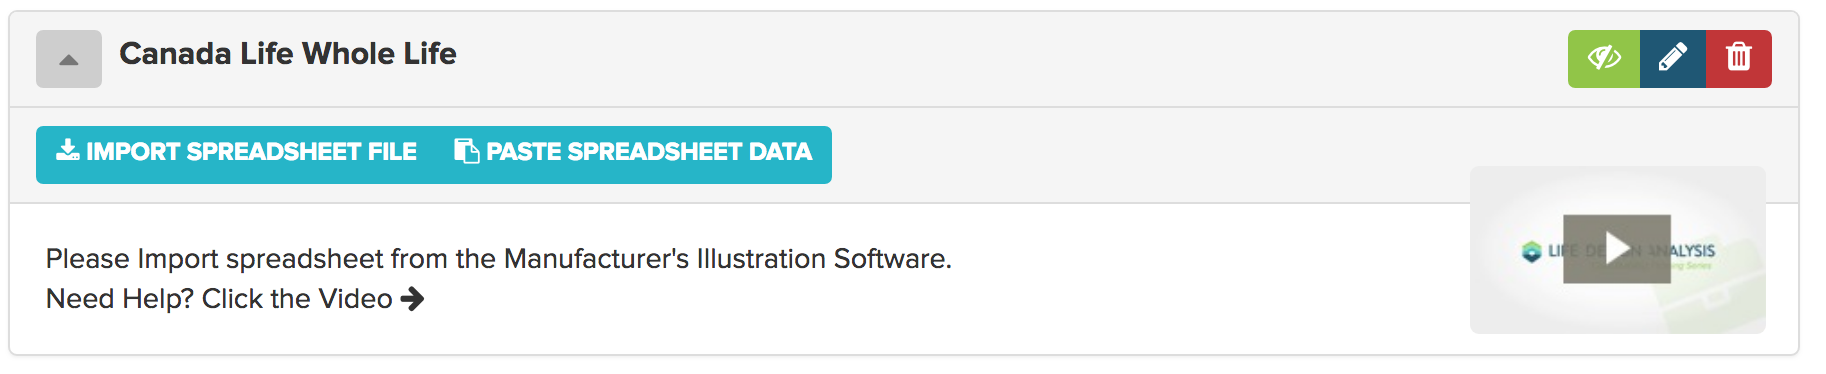
Simply copy and paste or upload the spreadsheet you have exported from the carrier software, for instructions on how to export an excel sheet view or step by step guides.
Recipes - Can also be used to add popular combinations of products at once, for example a Term 10 vs Term 20 vs Term 25 for a client who is buying insurance for a new house and new mortgage.
Watch our Recipes video to see how this works!
Once you have all the products you wish to compare, click Generate Report.


You can add as many products to a case/comparison, however, we find it most effective to have no more than 4 types of products. We also generally recommend adding one product from each different class (t10 vs t10 vs t10 does not make the best report). Think about selecting the best T10 from the survey and comparing it to the best T20 or the best Universal life or all three. Whatever product mix you select sell on time, not on initial price. (read our article on selling on time!)
At any time on the design case page you can specify what “report components” or pages of the report you wish to include. This is found at the bottom of the Design Case page. (Once you find the report components you prefer, you can set them as you default in the account settings for all future reports.)
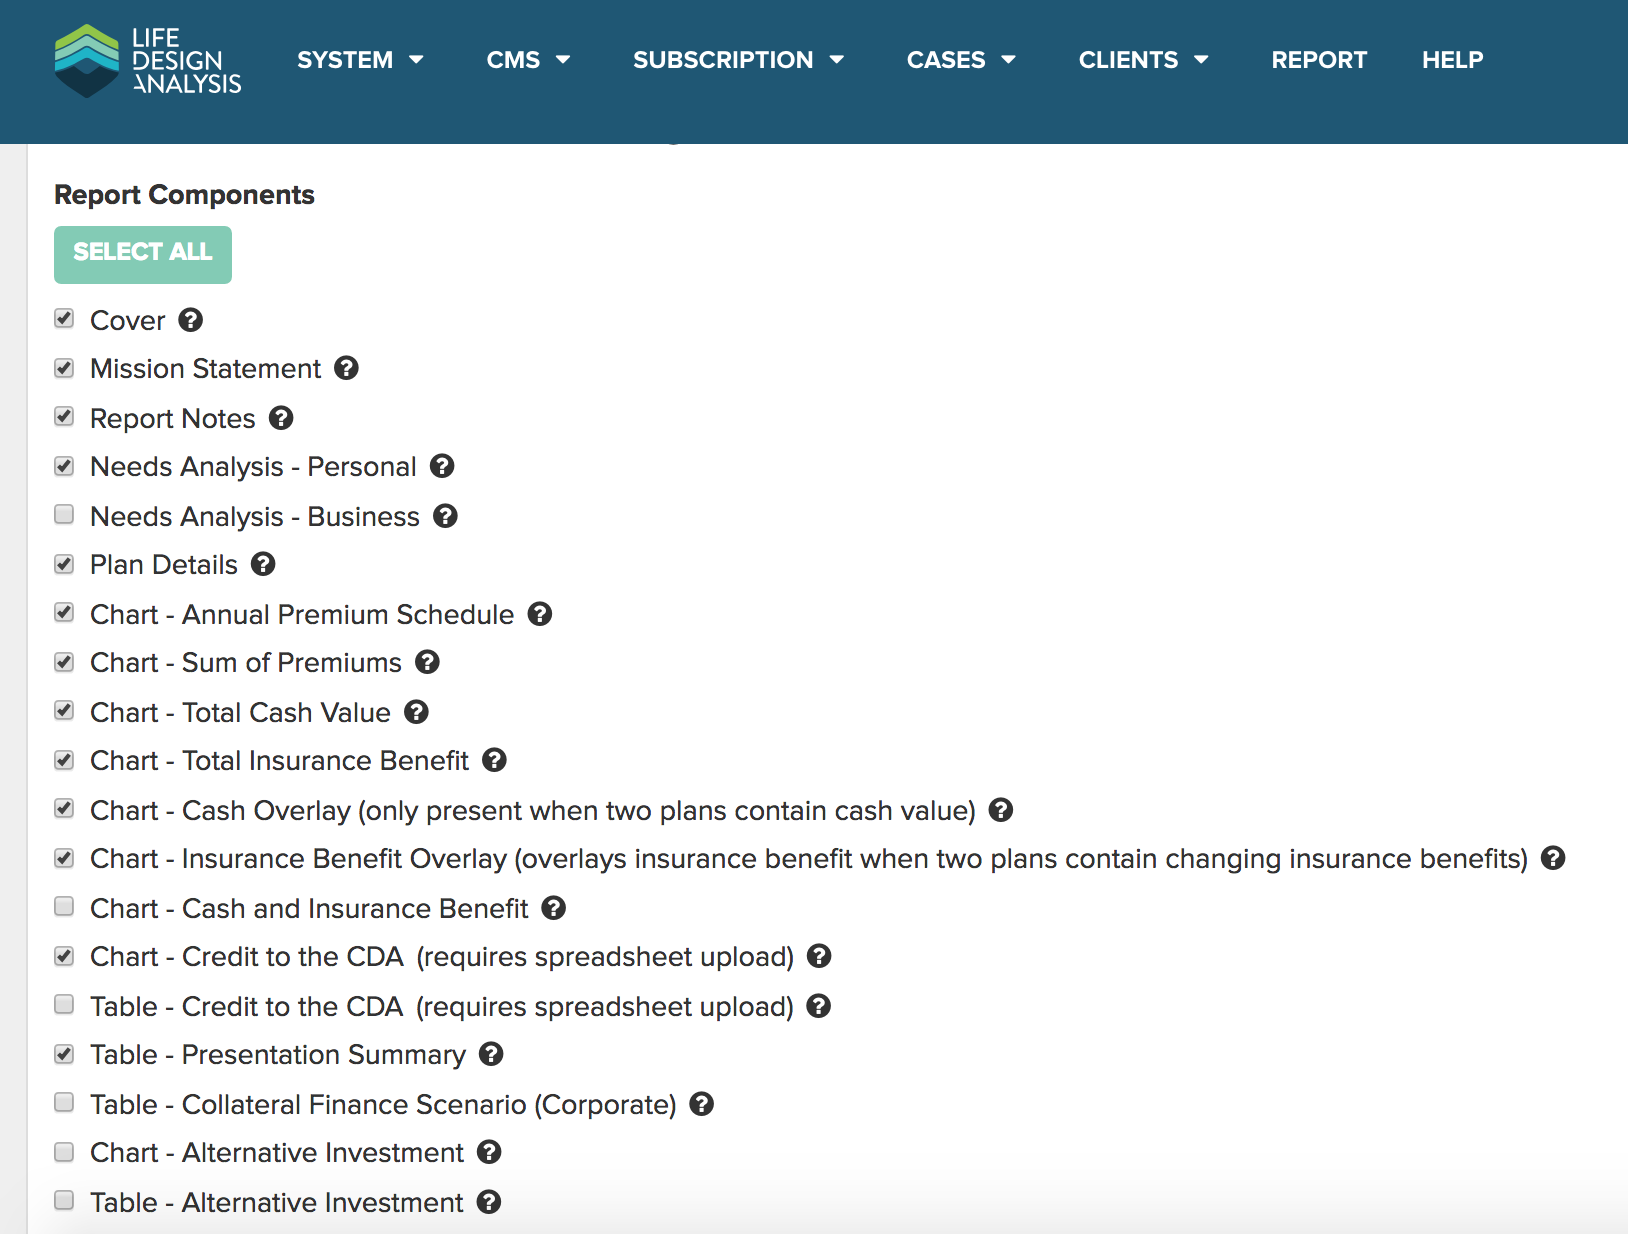
(If ever in question on what a page is designed for hover your mouse over the tooltip.)
Chapter 5: The Presentation
Ok great. That's how easy it is to create a fully branded report. I would recommend jumping to here in the video for a view of the report and its interactive nature. Needless to say there are many ways to present insurance solutions depending on the report components you have selected, so let’s jump into what each report component is intended to do.
Read our article on how to effectively present insurance! for creative ways to get insurance solutions in front of your clients!
Chapter 6: Report Components Drill Down
Ok so let’s just do a quick rundown on each report component.
Select All - This selects all the report components (once you hit select all there is an option to deselect all as well to make it easier to select just one or two report components).
Cover - The cover page of the report (this has your logo, information and client name).
Mission Statement - Customizable text that you can input in the account setting.This is anything you want to describe about your brand philosophy. Feel free to include links to forms and other items you use in the sales process.
Report Notes - Select from a concept. Create your own template or enter one off messages that will be shown on their own page of the report.
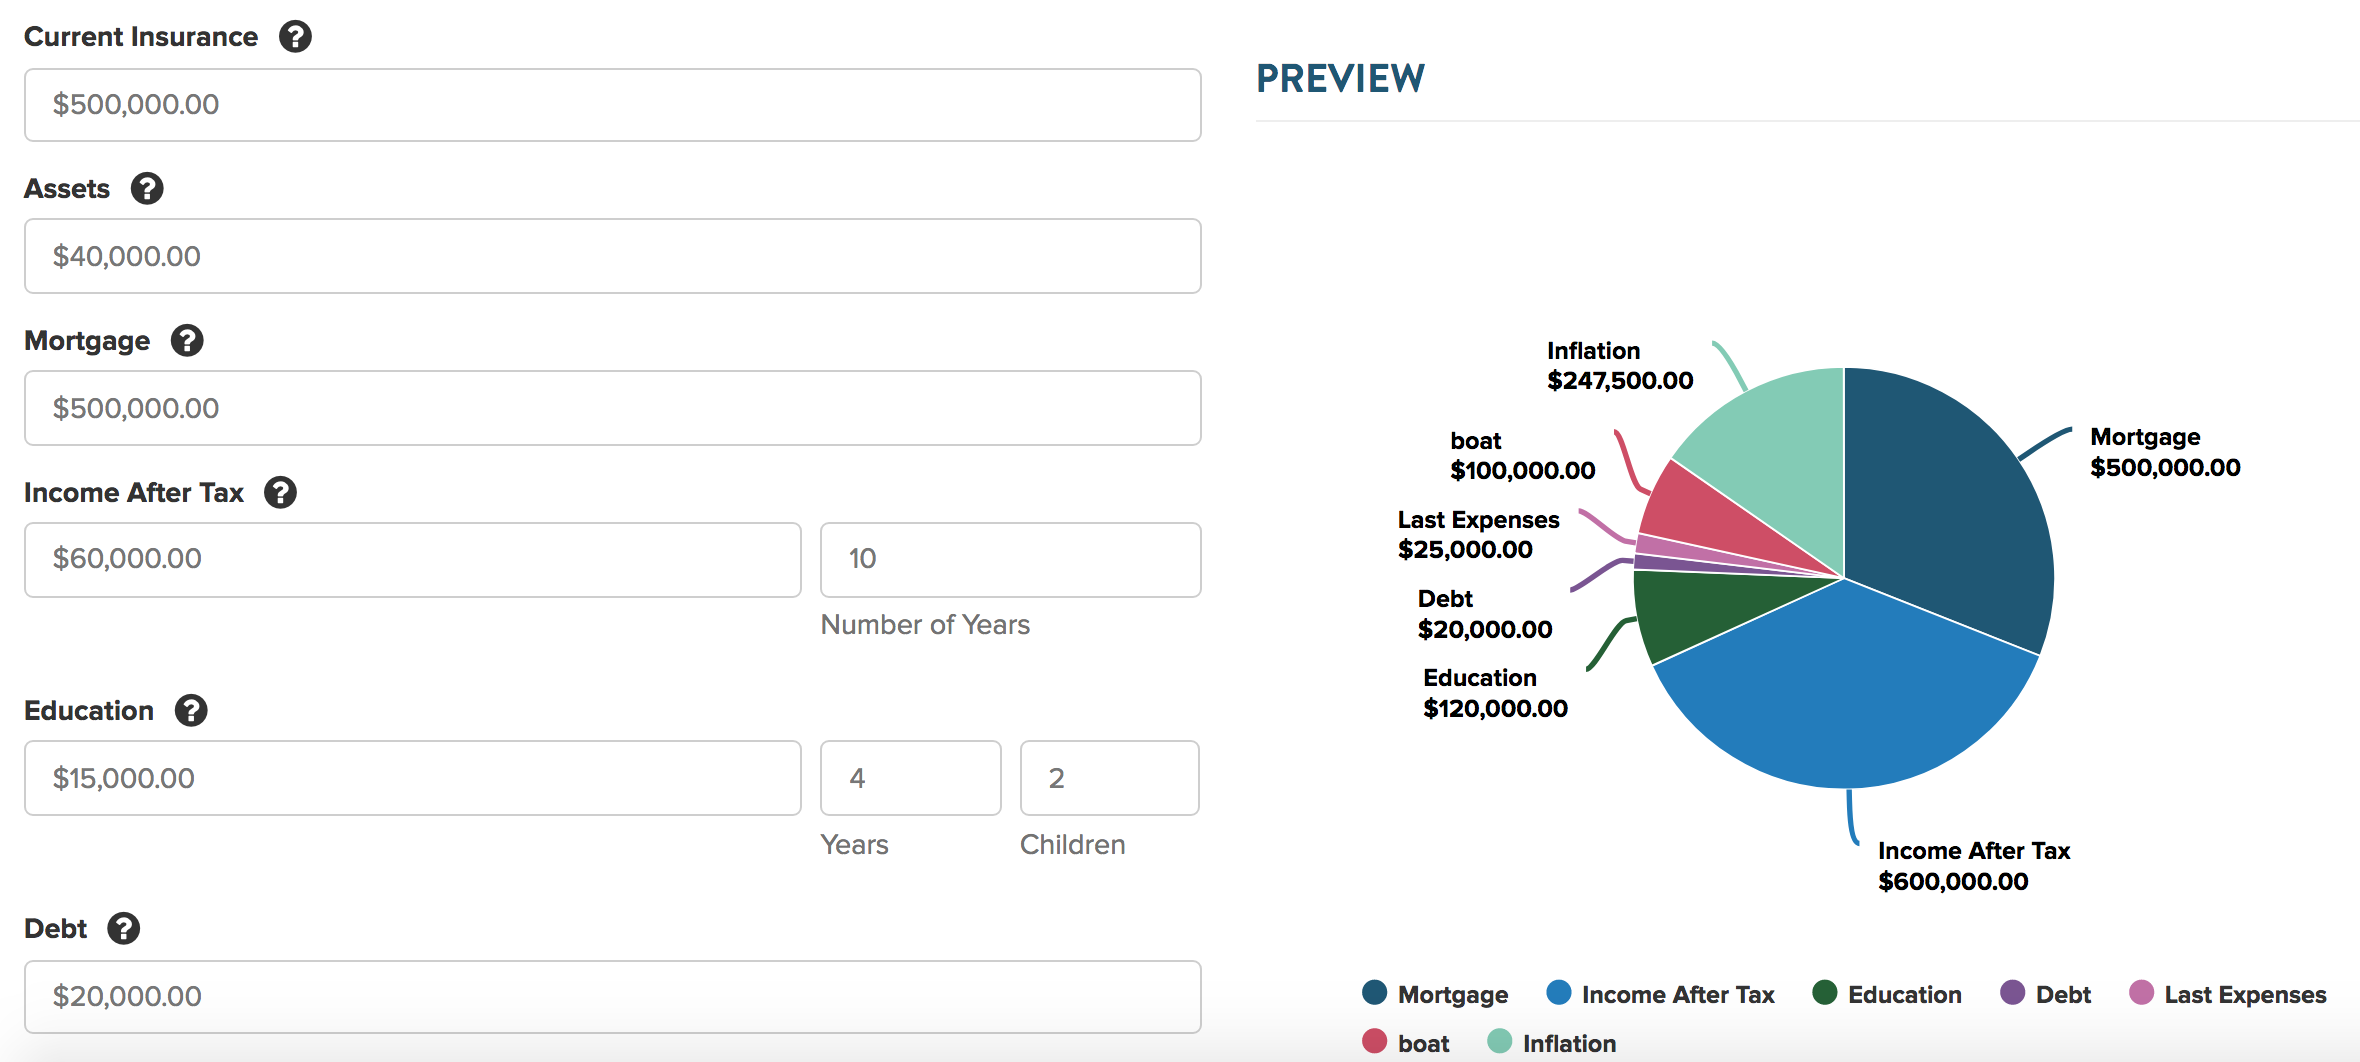
Needs Analysis - Personal - Our most popular insurance analysis. Fill in to establish and document a client's need. Share a link to have them fill in the information.
Needs Analysis - Business - Like or personal needs analysis but with unique fields for business owners.
Plan Details - The products you added to the case as well as their premiums and any additional details that have been added.
Chart - Annual Premium Schedule - This is a line chart of all annual premiums, show a client how premiums perform over time. Think of this as your digital napkin drawing.
Chart - Sum of Premiums - This is a line chart of cost. An addition of all premium deposits over time.
Chart - Total Cash Value - This is a bar chart of the total cash value of a plan. This chart will also contain reduced and guaranteed values if available.
Chart - Total Insurance Benefit - This is a bar chart of the total insurance benefit. This chart will also contain reduced and guaranteed values if available.
Chart - Cash Overlay (only present when two plans contain cash value) This bar chart will display the cash values of all plans on one page to more clearly see the difference.
Chart - Insurance Benefit Overlay (overlays insurance benefit when two plans contain changing insurance benefits) This bar chart will display the insurance benefit values of all plans on one page to more clearly see the difference.
Chart - Cash and Insurance Benefit - This bar chart is used in place of separate cash and insurance pages, it shows the premiums the cash value and the insurance benefit on one chart.
Chart - Credit to the CDA (requires spreadsheet upload) - This angular spline chart shows the credit to the Capital Dividend Account (CDA) Total insurance benefit - ACB
Table - Credit to the CDA (requires spreadsheet upload) - This table shows the credit to the Capital Dividend Account (CDA) Total insurance benefit - ACB
Table - Presentation Summary - One of our most popular components, this is a table of all costs, values and benefits for easy comparison.
Table - Collateral Finance Scenario (Corporate) - Models a scenario where a corporation would borrow money to pay a whole life insurance policy. Assumes interest and NCPI (relative to death benefit and outstanding loan.) are deductible.
Chart - Alternative Investment - Angular spline chart that models what an alternative investment at a net rate of return (controlled in the design case) vs the cash value of a policy.
Table - Alternative Investment - Table that models what an alternative investment at a net rate of return (controlled in the design case) vs the cash value of a policy.
Chart - Buy Term Invest The Difference - Angular spline chart modeling if the the difference between a permanent product and a term product (that you select) premium were invested what would the result be.
Table - Buy Term Invest The Difference - Table modeling the difference between a permanent product and a term product (that you select) were invested what would the result be.
Chart - Cost Per $1000 of Insurance - Donut chart of the cost that every one thousand dollars of life insurance costs. (as a chart this is done as an average over the time selected for the case)
Table - Cost Per $1000 of Insurance - Table of the cost that every one thousand dollars of life insurance costs.
Chart - Internal Rate of Return of Cash Value - Line chart that compares the internal rate of return of any plan with cash value.
Table - Internal Rate of Return of Cash Value - Table that compares the internal rate of return for any plan with cash value.
Chart - Internal Rate of Return of Insurance Benefit - Line chart that compares the internal rate of return of the insurance benefit.
Table - Internal Rate of Return of Insurance Benefit - Table that compares the internal rate of return of all insurance benefits.
Table - Equivalent IRR Required in a Taxed Vehicle (Cash Value) - Shows that the equivalent irr that would need to be achieved in a taxed vehicle vs that of the tax advantaged cash value inside the policy (you can set the tax rate of your client in the design case).
Table - Equivalent IRR Required in a Taxed Vehicle (Insurance Benefit) - Shows that the equivalent irr that would need to be achieved in a taxed vehicle vs that of the tax advantaged insurance policy benefit(you can set the tax rate of your client in the design case).
Contact Details - All your contact information that was set in the account settings.
Chapter 7: Importing Spreadsheet for Whole Life and Universal Life
Sometimes you will want to bring in a quote from the insurance carrier software. This could be for a rating or just for a product that can’t be illustrated from the search function.
We have step by step guides for all carriers here so I will give a quick step by step here but please reach out if you have any issues or consult the guides for more detailed view.
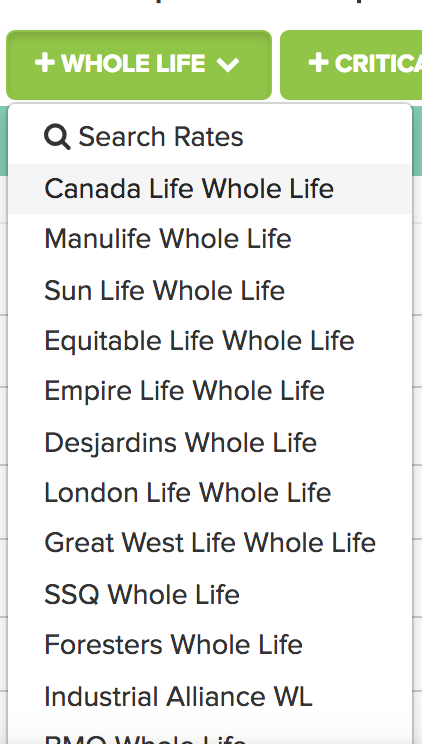
Step 1 - Click +Whole Life
Step 2 - Select your carrier of choice
Step 3 - Launch carrier software and create your quote
Step 4 - Export Quote to excel
Step 5 - Copy and paste or save spreadsheet then import into LDA to applicable area
Want to see this for a specific carrier visit the guides area of the help center
Chapter 6: Buy Term Invest the Difference
When creating a buy term invest the difference strategy you must first have a plan with cash value and a term product added to a case. (*note you don’t have to have the term plan visible for this to work we just need the data from that plan)
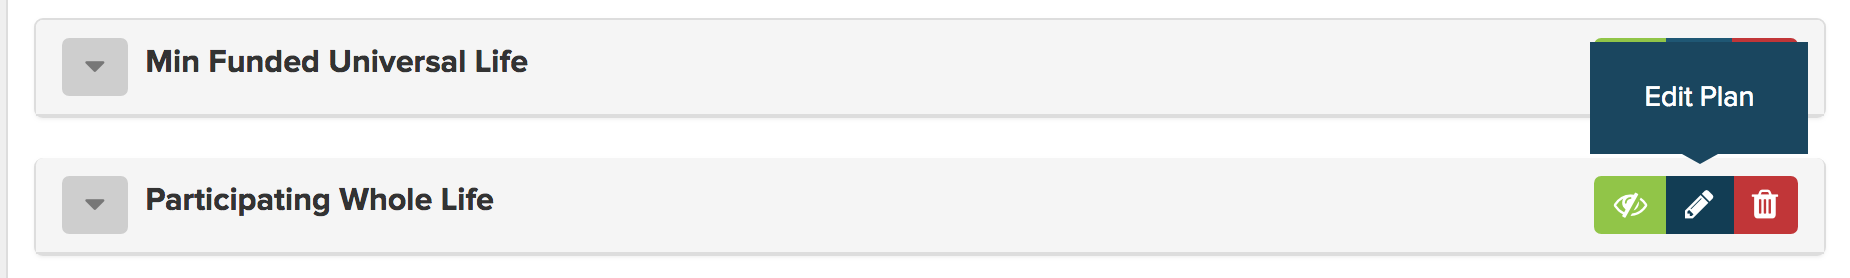
Step 1 - Click edit plan on the plan with cash value.
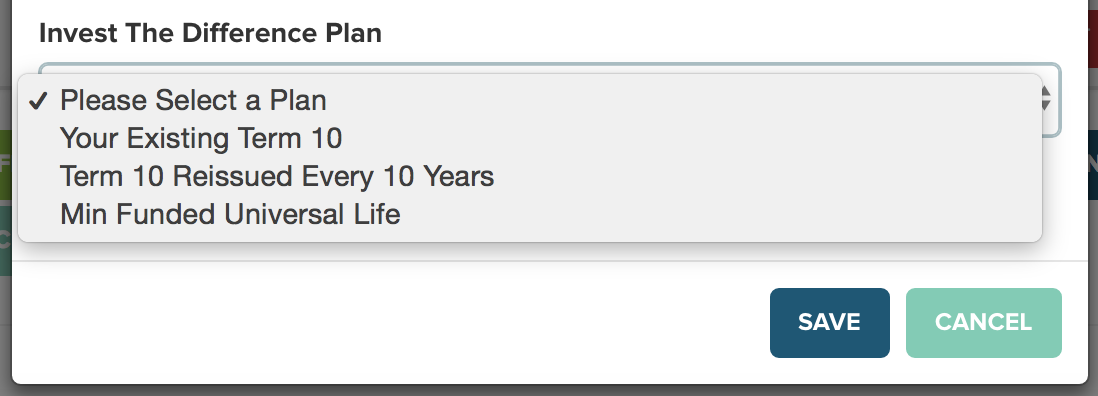
Step 2 - Go down the the bottom of the form and select the plan you want to use the difference in premium from.
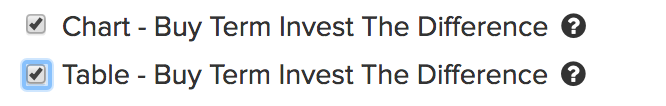
Step 3 - Make sure you have the report component selected from the check list
You are also able to adjust the net rate of return used for the Buy term invest the difference report in the design case controls.

Chapter 7: Case Sharing & Marketing
Life Design Analysis has a revolutionary feature that lets you link your clients to the reports you create for them. Clients can not make changes to these reports however they can interact with the charts, and leave comments for you. The best part is you get notified and given stats on how long and when they viewed your report.
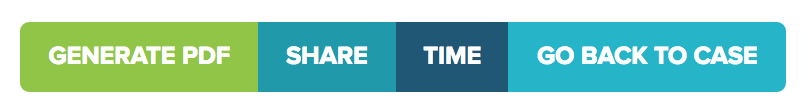
Step 1 - To share a case simply generate your desired report and click the share button button.
Step 2 - Copy the link
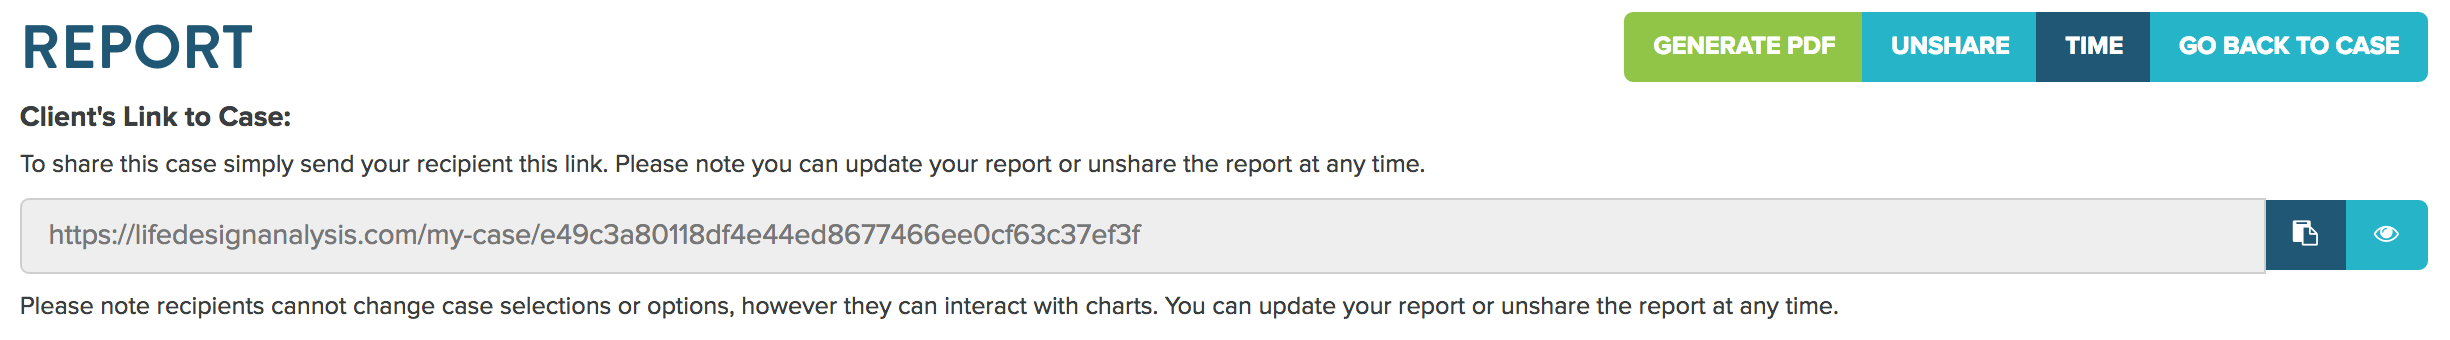
Step 3 - Share with your client. You could email, text or share via your prefered messaging platform. Some concepts can even be used on social media.
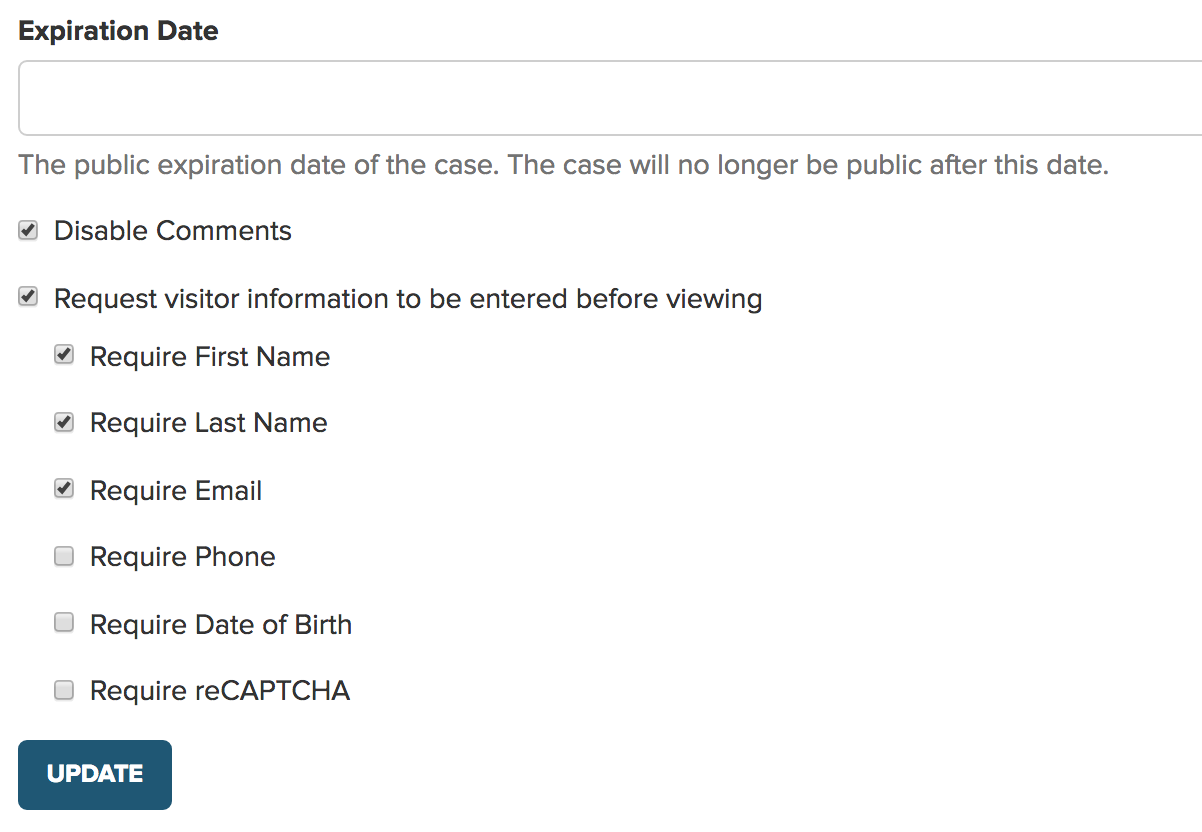
It’s also important to note when you are sharing a case you can set an expiration date and require other information.
Chapter 8: Needs Analysis
Needs analysis reports can be created from the main dashboard or can be set from inside the design case page by clicking the edit button underneath the client details.
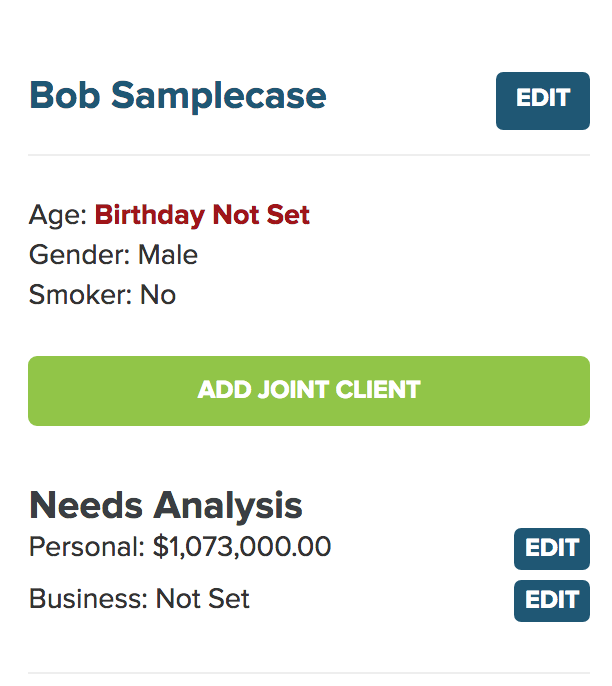
Simply click edit and fill in the fields and hit save.
When you enter through the design page You can also create a link so your clients can populate the information. To do this click can copy the url. Share with your client like we did in Chapter 7 and they can input their details.
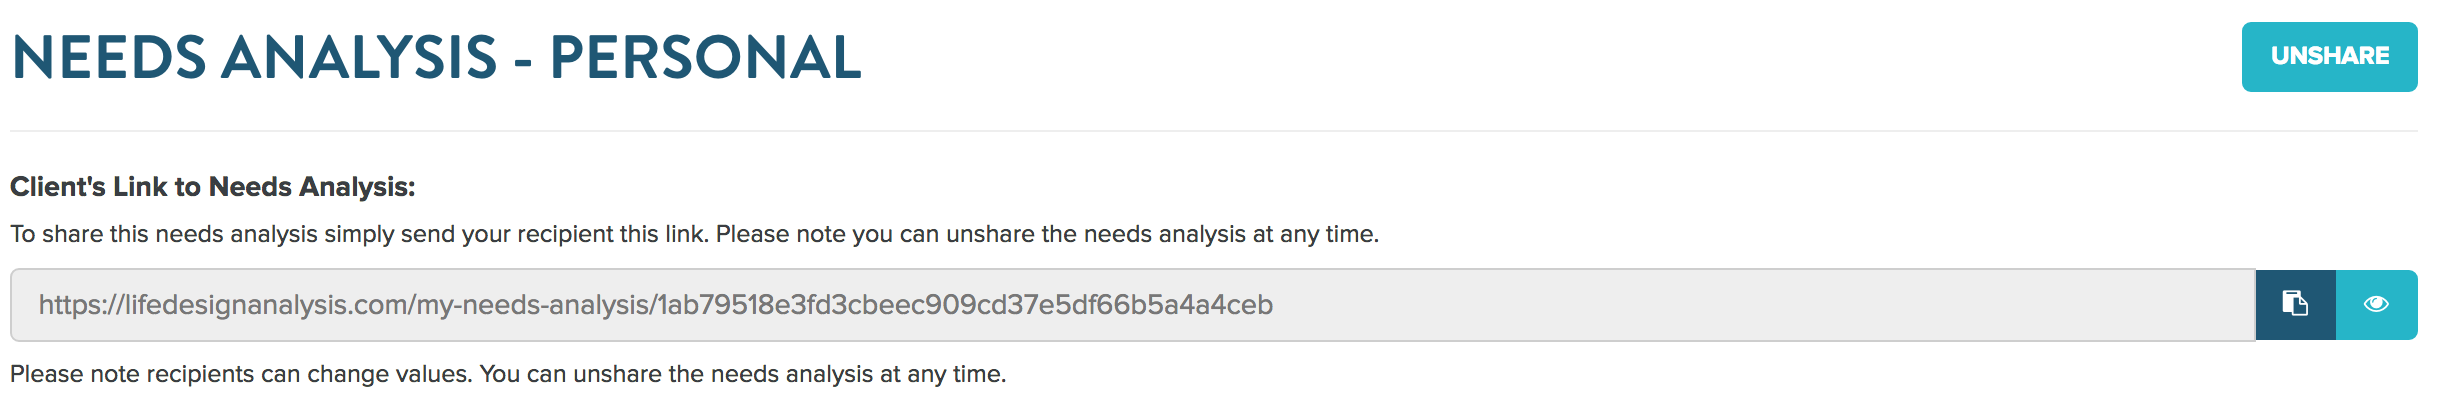
There are handy tool tips for consumers on the client side.
Chapter 9: Importing Clients
Importing clients into LDA is a simple as obtaining a spreadsheet of your clients and their policy details. We use this information to help you quickly create comparisons without having to re input data. We also use this information to send you notifications and automate policy comparisons at critical milestones for things like term conversions, term ten exchanges and term 20 conversions. We can also send you a notification for client birthdays.
We created a full step by step guide to importing clients here
Chapter 10: Case Studies
In this chapter, I wanted to address some common situations and how you might prepare your case in LDA.
Young Buyers - Term vs Time: With young buyers, cash flow is always an issue. In these cases, I find it’s great to do a needs analysis to show a young buyer how much insurance they might need but it's ok to focus on locking in their insurability and focusing on a monthly premium. I recommend presenting different term lengths and trying to match the need with the time of term. Many younger buyers have student debt, young families or new houses comparing term 10 vs. term 15 or 25 can show how they can pay a small amount more in the short term to protect their needs better and save long term.
Existing Policyholders - How to set up a term conversion: Existing term policies are some of the best opportunities for sales and client service. Because they are closer to their guaranteed renewal date, there is almost always an opportunity to show clients value in their conversion or replacement options.
Term 10 - Sold in last 5 years: Term policies sold in the last 5 years represent a great opportunity. Often younger buyers purchase term 10 as it’s all they can afford. After a few years their situation changes. This is a great strategy to open a conversation with a client and compare their existing term 10 policy to a conversion to a term 20. This helps the client protect their needs longer and it gives you a good opportunity to keep your clients from shopping the market.
Retirement Plan People who “won’t need insurance” : Many times people have the idea they will self insure by buying short term insurance and assuming they will either make enough money or not have any liabilities to have any need for any permanent insurance. Even if you don't agree with this strategy we can still set up a number of term options including layered options that include term 10, term 20 and T65 or T75. This gives high protection with low cost and a changing insurance benefit designed to match their retirement plan. Use our term rewrite metric to show how term increases in price even if you stay healthy as a reason to go with the T65 or T70
WL vs. an Alternate Investment: Many times people believe they could invest the premiums and make more money than would accumulate inside the policy (even if they are willing to take the risk of having no insurance). It’s often a good idea to show them how this strategy works out using our alternate investment. After all, life insurance was designed to fund a liability at a lower cost.
Cascading Life Insurance Plan: Many parents and grandparents are looking for ways to give to their children and grandchildren. A life participating life insurance policy can be a great way to provide a safety net of insurance but also build cash value that can be used for education etc. Check in the help center for our cascading life insurance strategy and set up a mailer with your clients.
Charitable Giving Plan - Using life insurance for charitable giving is a great way to enhance the impact of every dollar you give. Download and share our charitable giving using life insurance campaign from the help center if this concept appeals to you.
Critical Illness is an important part of every financial plan. Much like term I recommend comparing different lengths of time. With CI because underwriting as your clients age you may want to show how a CI rewrite looks. It may shock your clients that even if they stay healthy, CI at later ages becomes very expensive and very hard to get an offer. Showing ROPD/C/X is a great way to show value if they are worried that they are healthy and may never use it.
For more case studies check out our blog on handling customer objections
Thank you for more LDA resources register for our monthly webinar
Visit the Help center
Read our Blog
Reach out on our live chat on the site (right hand side)
Give us a call 1-844 (532-4636)